AI + IQ-11 = Faster 1D Gel Analysis
Introduction
Together, we will combine our Intelligent Quantifier-11 (IQ-11) algorithms, used by customers around the world, with a training set of your gel samples to calibrate each sample, find its lanes, find and quantitate its bands, assign them standards values, and report results. It will work with blots, too. IQ-11 is fully compliant with 21 CFR Part-11.
We look forward to saving you hundreds of hours. Maybe even more.
Whenever we hear "artificial intelligence" we always bring up this cartoon. Why? Because AI isn’t some magic wand we can wave to make all your problems disappear overnight. It will take work on both our parts; and yes, maybe we'll have to back up once (or twice) and try a different path.
1. Find the Calibration Strip
This Step is Straightforward
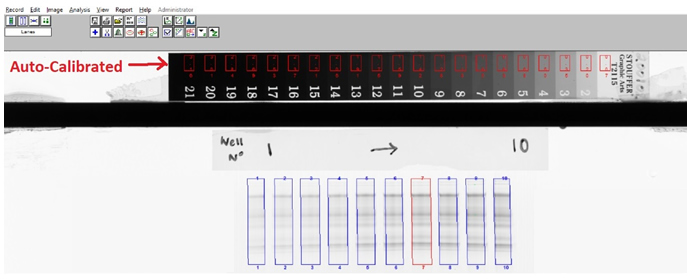
Our first task is to find the calibration strip. If you use a Bio Image auto-calibrating scanner, we don't need to look for the strip; acquiring the sample automatically finds it. In the image below, the thick black bar is the water-tight dam separating the sample portion of the gel tray from the calibration strip.
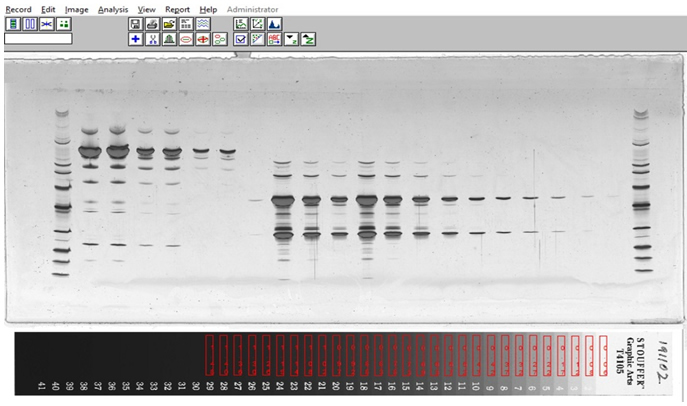
The sample below was acquired on a Bio Image scanner, but not an auto-calibrating one. We'll run profiles from side-to-side (or top-to-bottom, if the calibration strip is placed vertically), looking for the black end monotonically decreasing steps. Once we know the outline of the strip, we can find the steps, and quantify the pixels within each one.
Our Bio Image scanner comes with a National Institute of Standards and Technology (NIST) certified and calibrated strip, which lets you make meaningful quantitative comparisons between samples.
2. Find the Lanes
This Step is Straightforward, Too
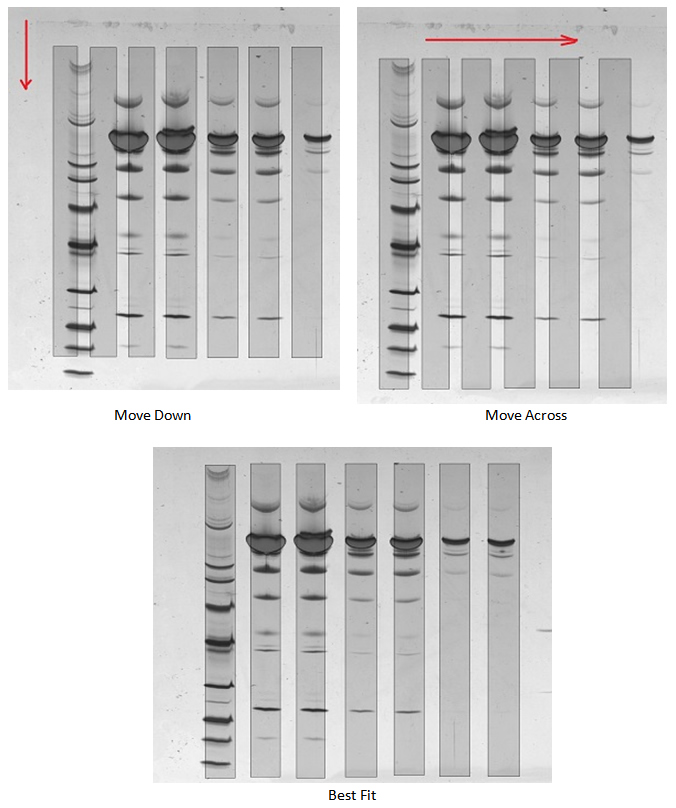
Your gel cassette gives us the number of lanes, and their approximate expected width and length. We’ll use these to create a template which we will pass over the sample from upper-left to lower-right, comparing the gray tone of the template to the image pixels. The best fit will be when the template is atop the lanes.
3. Find the Bands
The Next Two Steps are the Hard Part, and Good Results Won't Come Overnight
You will build up a training set of samples, on which operators have detected bands using our algorithm and then manually added and/or deleted bands.
And then we'll incorporate any processing protocols you have. Examples of protocols might be which lanes have saturated silver-stained bands, or minimum/maximum quantitative values for specific bands, or deciding which reference or sample lanes from the basis of further calculations.
This step will likely continue for a while, as new samples are added to the training set, and potentially teach us new tweaks to where and how we find bands.
Our Algorithm
The algorithm calculates the second derivative of each pixel on a lane's densitometry profile. This measures change, which is what we're looking for; and it yields a set of peaks and valleys. All the profile between any pair of valleys is a potential band, but those must meet a darkness criterion, which is also part of our algorithm. Contact us if you’d like full explanation, complete with equations.
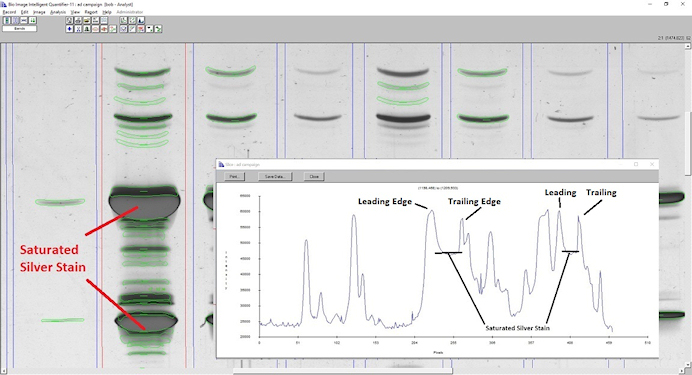
The algorithm did a pretty good, but not perfect, job. You might want some of the faint bands detected. And it definitely saw the saturated bands as two: one on the leading edge, and one on the trailing edge. When you look at the lane profile, it’s obvious why that happened.
Manual Editing
Here is where you take over: adding bands you think IQ-11 missed, and deleting those you think it shouldn't have found. IQ-11 records all of these actions, helping it learn what lane profile characteristics necessitated manual edits. This learning process will be on display during the validation of results as new samples are put up against the training set.
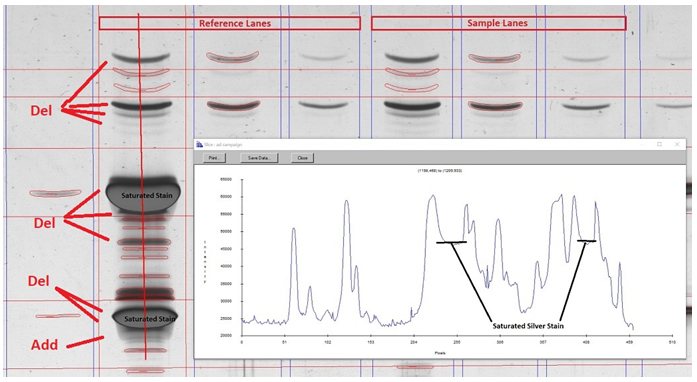
The operator deleted 9 bands, and added 1. In fact, these edits combine both differences between IQ-11's algorithm and the manual editing, but also incorporation of the sample protocol, as mentioned above. The samples have 3 Reference lanes, and 3 Sample lanes. According to the protocol, when the Reference or Study lane has saturated bands, the top 2 darkest bands are ignored in favor of the bands in the adjacent lanes.
4. Determining Band Volume
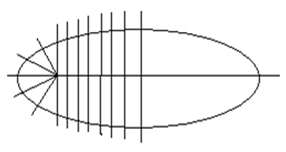
IQ automatically fits each band with a 36-sided polygon which reflects the shape or outline of the band. This polygon defines all pixels used in the quantitation of the band. Thirteen vertical cross-sections are taken between the two end-points, and five points on each end.
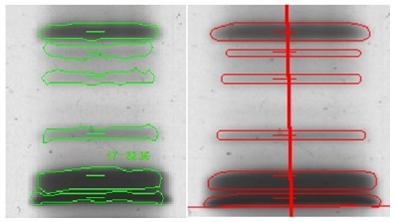
Like band detection, band quantitation can also be done manually: the operator marks a series of boundary points which are used in place of IQ-11's automatically detected points. In the image below, the IQ-11 points are on the left, and the manually marked points on the right.
As you might expect, the operator's points are "smoother."
The operator sees his or her points on the edge of a band. But they really are points on one of the cross-sections, and that is how IQ-11 will combine your training set into its results. On a band-by-band basis, if necessary.
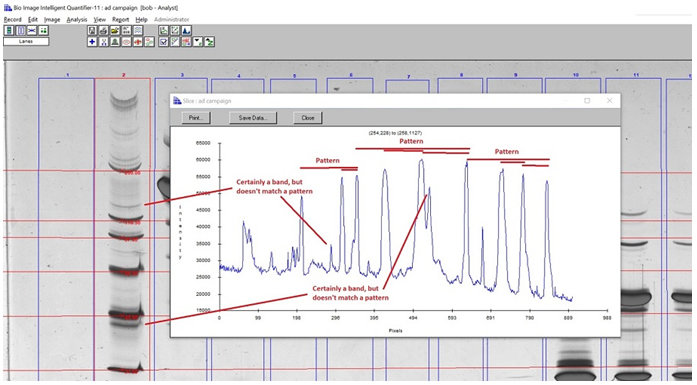
5. Calculate Standards Values – Molecular Weight (Mw), Iso-Electric Focal (IEF), or Concentrations
We're Back to Another Straightforward Step
Your gel cassette has specific lanes for any Mw/IEF and/or concentration/dilution standards. So once IQ-11 locates the lanes, it knows which lanes have standards values. The training set has identified what bands in those lanes have what standards value. That information gives IQ-11 a pattern to look for, as shown below.
6. Report Results
This Step is Also Straightforward
IQ-11 has almost 60 different data items for every lane – for example, Total Volume of All Bands, or Band Detection Width – and over 30 data items for every band – for example, Band Area, Band Dilution, or Band Mw/IEF. What items, and in what order, are specified in a Report Template, letting you customize how you see the data for a sample.
But IQ-11 reports can be customized for proprietary calculations, too. This is especially helpful if you’ve been using Microsoft Excel®, have migrated to Office 365®, and want to avoid continual revalidation of your calculations every time Office 365 has an update. In the report below, the entries in red were previously done in Excel. The "Fitted Curve" and two chain columns were calculated with Excel's regression feature.
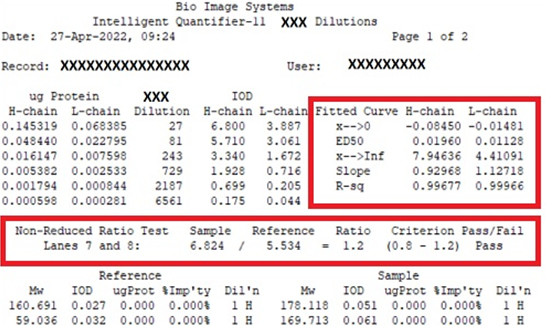
(Data items containing proprietary or identifying information have been XX’d out)
Summary
Together, we combined IQ-11's proven algorithms with a training set of your samples to calibrate each sample, find its lanes, find and quantitate its bands, assign them standards values, and report results.
And saved you hundreds of hours. Maybe even more.
Have any questions or need help?
Send us an email to info@bioimage.net. We are here to help you and answer any questions that you may have.