Intelligent Quantifier
Software Overview
The Bio Image Intelligent Quantifier (IQ) is a software system for analyzing scanned images of 1-D and 2-D electrophoresis separations, blots, and colonies/plaques. Using the IQ software you can analyze gel files obtained from protein, DNA, RNA, or blot samples and report the data. (Details further below)
General Features
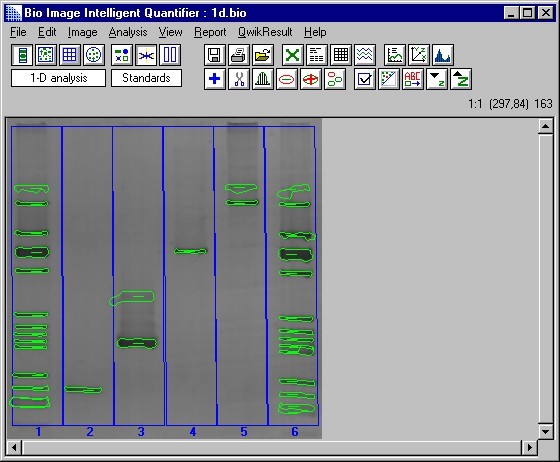
1-D Electrophoresis Analysis
2-D Electrophoresis Analysis
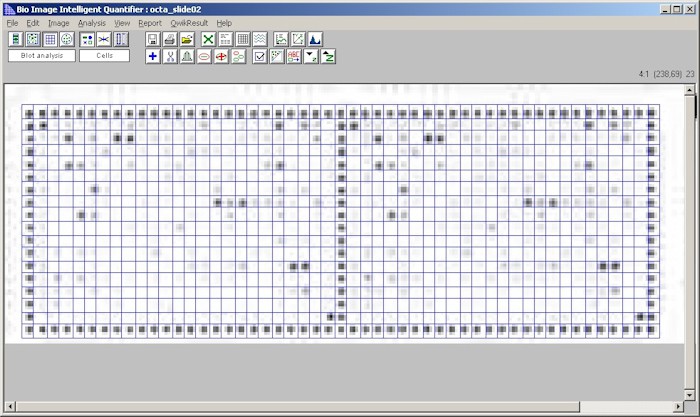
Dot and Slot Blots
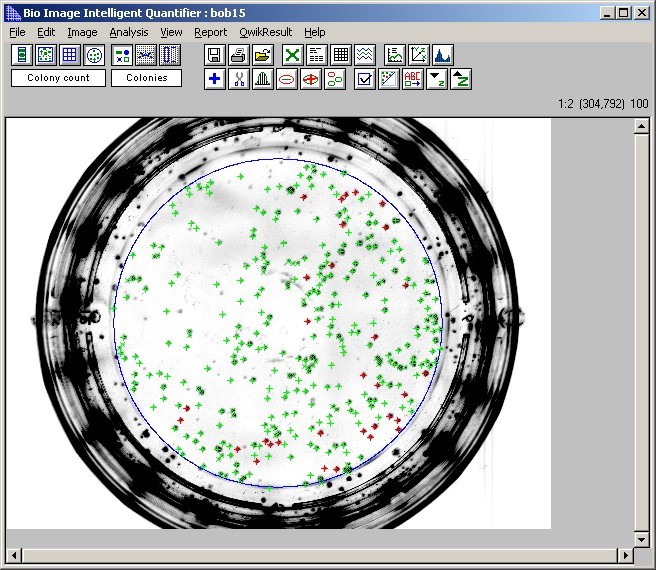
Colonies/Plaques
(Click on images to enlarge)
-
IQ Software
-
IQ Software
-
IQ Software
The IQ software is available for PC and Mactel.
Ideal for clients who do not require compliance with 21CFR Part 11.
Printable version of product features. (PDF)
Fully functional demo software.
General Features
- Analyze protein, DNA, RNA, carbohydrate, colony & blot samples
- Analyze wet gels, dry gels, autorads, blots or photographs
- Import TIFF, JPEG, or BMP files
- Display intensity in optical density (OD)
- Name an individual band, spot, cell, or colony
- Illustrate images with circles, arrows, boxes, and text; combine an image with text for publication-quality work
- Generate band, spot, colony and blot data analysis reports
- Export images and/or analysis in standard TIFF, JPEG, Postscript®, and ASCII formats
- Comprehensive on-line User's Manual
1-D Electrophoresis Analysis
- Automatically detect lanes and find bands
- Find irregularly shaped bands, i.e., biphasic bands, "smiling bands," or saturated bands that are substantially wider than the rest of the lane
- Vary band detection sensitivity to optimize performance to gel characteristics
- Quantify bands with actual band boundaries based on inflection point analysis
- User-specified Logarithmic, Linear, or Reciprocal methods of interpolation for standards
- Side-by-side lane profile and band size/quantification comparisons
2-D Electrophoresis Analysis
- Automatically identify spots in a user-defined area
- Analyze very complex (10,000 spots) gels
- Quantify spots using 36 radians per spot for accurate and reproducible quantification data
- Local background for each spot
- Logarithmic or Linear interpolation of Mw and pI standards
Dot/Slot Blot Analysis
- Dot and Slot Blot samples from 1 row by 1 column, up to 52 rows by 52 columns
- Automatic quantification of individual blot cells
- Automatic or manual background
- Normalize cells to a specified row, column, or cell
- Concentration standards can be assigned to user-selected cells
Colonies/Plaques
- Count colonies in a user-defined area
- Analyze very complex (10,000 colonies) samples
- Determine local background for each colony