Advanced Quantifier
Software Overview
The Bio Image Advanced Quantifier (AQ) is a software system for analyzing scanned images of protein or DNA samples run in one-dimensional separations, including Northerns, Southerns and Westerns, RAPDs, STRs (micro satellites), Paternity and forensic analysis using RFLPs or STRs, Strain identification and comparison using RFLPs or STRs, and other genetic mapping applications using 1-D molecular techniques. The software automatically locates lanes and bands. On command, it determines band size and quantity of sample present in comparison to standards or reference lanes. (Details further below)
General Features
1-D Electrophoresis Analysis
Matching
Reporting
(Click on images to enlarge)
-
AQ Software
-
AQ Software
-
AQ Software
The AQ software is available for PC.
Ideal for clients who do not require compliance with 21CFR Part 11.
Printable version of product features. (PDF)
Fully functional demo software. (For Windows 7, XP)
General Features
- Analyze protein, DNA, RNA, or any other 1-Dimensional sample
- Analyze wet gels, dry gels, autoradiograms, blots and photographs
- Import of TIFF, JPEG, or BMP files
- Display intensity in optical density (OD)
- Name an individual lane or band
- Illustrate images with circles, arrows, boxes, and text; combine an image with text for publication-quality work
- Generate lane and band data analysis reports
- Export images and/or analysis in standard TIFF, JPEG, Postscript®, and ASCII formats
- Comprehensive User's Manual hard copy and on-line help
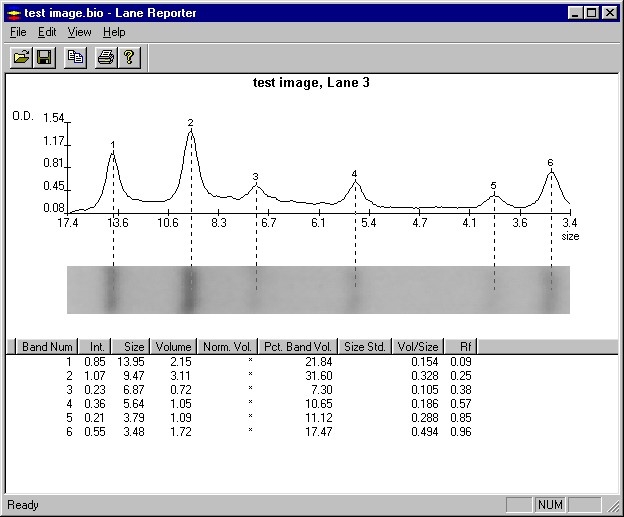
1-D Electrophoresis Analysis
- Automatically detect lanes, find bands, including irregularly shaped bands, i.e., biphasic bands, "smiling bands," or saturated bands that are substantially wider than the rest of the lane
- Vary band detection sensitivity to optimize performance to gel characteristics
- Quantifies bands by defining actual band boundaries based on inflection point analysis
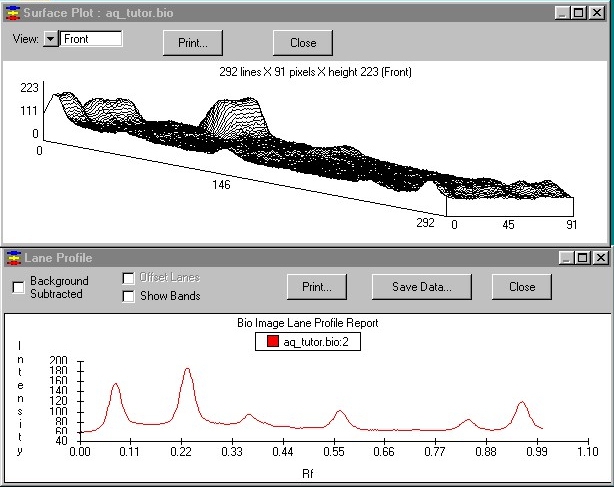
- Subtract local background
- Side-by-side lane profile and band size/quantification comparisons
- Quantify by whole band and densitometry methods
- Specify methods of interpolation for standards from three methods: logarithmic, Linear, and Reciprocal
- Display single lane density profiles or multiple overlay profiles
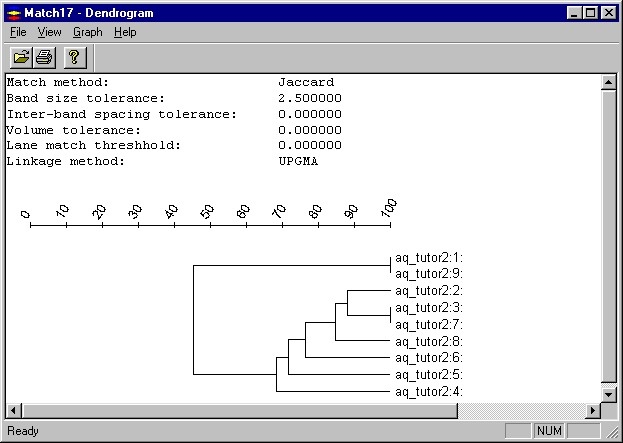
Matching
- Analyze data with powerful data management and database capabilities. Create and search databases and compare band patterns across large populations
- Compare fingerprints or band patterns within a single sample, or across thousands of samples
- Build DNA, RNA, or protein-based taxonomy studies for many strains or organisms
- Make genomic identifications in agricultural, forensic, or paternity applications
- Determine matches using Mw, interband spacing, or volume
- Three methods for calculating band-sharing frequency
- Build similarity dendograms using one of five clustering techniques
- Lane labels to match just lanes of interest (e.g., just match Control lanes)
- Show matching lanes from any image, for easy verification reporting
Powerful Reporting Capabilities
- Customize reports and display them on screen, print, save as a file, or copy to spreadsheet programs
- Choose from dozens of data items for the report header, lane headers, and individual bands
- Show the size or concentration curves
- Display band data including peak height, area and volume for the whole band, relative volume and Rf
- Show side-by-side band comparisons, lane densitometry profiles, 3-D surface plots, and image histograms